Introduction
In this article, we will be covering the details of why Glimpse is used, what Glimpse has in store for developers.

We have been using MiniProfiler in MVC projects to detect the performance of the Queries called in the server. The number of requests made by the browser to the server, the response time and many other options a developer would get using these extensions.
Glimpse is a new platform for developers to judge their applications. It is an open-source & free diagnostics platform for the web. This is used to get the information about the Asp.Net Web Forms & Asp.Net MVC applications. In simple words:
Quote:If you want to know what exactly is happening on your server, Glimpse will show you.

In this article, we will be using Asp.Net MVC for demonstrating the Glimpse usage. Glimpse is just like Chrome developer tool/Firebug for our server. Glimpse dictionarily** means momentary or partial view, thus it gives us a glimpse of inner workings of Asp.Net applications. It does this by gathering detailed diagnostics information about the behaviour and execution of the application and sending back the data along with the page with separate javascript overlay. Glimpse shows us what data was sent to the server & what data the server sent back, detailed information regarding what code eactly got executed on the server and how long it took.
Why Glimpse is different??

We might now think it is almost same as the Chrome developers/firebug tools, but Glimpse is quite much different than these tools. Even though, it looks the same as the developer tools but still serves a completely different purpose. Glimpse is more focussed on the server. Lets understand the diffenrence more through a small diagram:

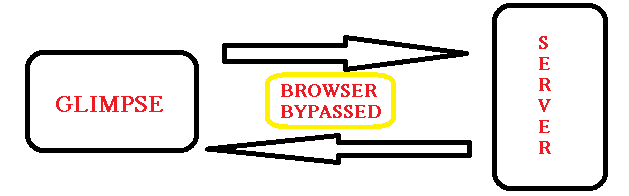
Here in the above diagram the dev tool take into consideration the viewpoint of the browser not the server, All the data we get in chrome developer tool is the data that came from the browser not the server. We can get to know the time taken for the request from the time the browser sent the request to the time it gets back response from the server. Here is where the Glimpse come into action, it gives the actual time taken by the exact or particular code executed for the request on the server, that is Glimpse bypasses the Browser in between. See the below diagram:
Glimpse shows us all kinds of information of an MVC application like what routes are registered, what connection strings are used, what flow was through the MVC pipeline, even the configuration present in the Web.config and what Models are bound.
Getting Glimpse
Considering the readers of this article have worked on Asp.Net MVC application and used Nuget package to install plugins and extensions, the easiest way to download and install Glimpse is Nuget Manager or can also be installed through Package manager console. Look at the diagrams below to get both the approaches: 
As you can see in the above image, I have already Installed Glimpse for MVC5, as we install Glimpse MVC4/5/3, the dependencies like Glimpse Core, Glimpse ASP.Net also getinstalled and the references gets added. The above approach is through Nuget package. Below diagram is the approach through Package Manager Console:
 Both the approaches install the Glimpse with the latest version and also add references for the dependencies. This makes changes to the Web.config adding configuration settings for the Glimpse which is shown below:
Configurations
Custom Section :
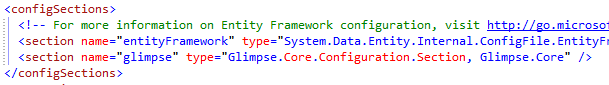
The diagram below represents the creation of a section inside the Web.config for Glimpse
HttpHandler & HttpModules
The diagram below represents the HttpModules and HttpHandlers created for the Glimpse. Glimpse needs a custom HTTP module and HTTP handler with ASP.NET, in the section if you have IIS 6 or earlier, or in the section for later versions of IIS.
There are two types as mentioned above system.Web & system.webServer
For system.Web
|
1 2 3 4 5 6 7 8 |
<system.web> <httpmodules> <add name="Glimpse" type="Glimpse.AspNet.HttpModule, Glimpse.AspNet"> </add></httpmodules> <httphandlers> <add path="glimpse.axd" type="Glimpse.AspNet.HttpHandler, Glimpse.AspNet" verb="GET"> </add></httphandlers> </system.web> |
For system.webServer
|
1 2 3 4 5 6 7 8 |
<system.webserver> <modules> <add name="Glimpse" precondition="integratedMode" type="Glimpse.AspNet.HttpModule, Glimpse.AspNet"> </add></modules> <handlers> <add name="Glimpse" path="glimpse.axd" precondition="integratedMode" type="Glimpse.AspNet.HttpHandler, Glimpse.AspNet" verb="GET"> </add></handlers> </system.webserver> |
Main Configuration
I mentioned main configuration as all the manipulations to be done lie changing the configuration for ignoring or adding new tabs to the Glimpse overlay is done here. The configuration looks as below:  Lets look at how the changes are done:
Change Configuration
Configuring the Tabs shown for the Glimpse:
There are mant tabs shown by default to the user. Here I will show you how to disable any tab, to avoid readability issues. Lets see what tabs are shown. Below is the list:
The default Glimpse tabs are:
- Diagnostics:
- Timeline – Glimpse.Core.Tab.Timeline
- Trace – Glimpse.Core.Tab.Trace
- ASP.NET:
- Configuration – Glimpse.AspNet.Tab.Configuration
- Environment – Glimpse.AspNet.Tab.Environment
- Request – Glimpse.AspNet.Tab.Request
- Routes – Glimpse.AspNet.Tab.Routes
- Server – Glimpse.AspNet.Tab.Server
- Session – Glimpse.AspNet.Tab.Session
- ASP.NET MVC:
- Execution – Glimpse.Mvc.Tab.Execution
- Metadata – Glimpse.Mvc.Tab.Metadata
- Model Binding – Glimpse.Mvc.Tab.ModelBinding
- Views – Glimpse.Mvc.Tab.Views
- ADO.NET:
- SQL – Glimpse.ADO.Tab.SQL
These are the default Tabs shown. We will consider only the Diagnostics and the Asp.Net MVC types and how to disable them. The configuration change for disabling is very simple and small. Remember this ignore types are to be added to the Main cofiguration.
|
1 2 3 4 5 6 7 |
<glimpse defaultruntimepolicy="On" endpointbaseuri="~/Glimpse.axd"> <tabs> <ignoredtypes> <add type="{Namespace.Type, AssemblyName}"> </add></ignoredtypes> </tabs> </glimpse> |
Configuring the Runtime policy:
Policies control what Glimpse is allowed to do at any given request from the browser. Ploicy by default is Local Policy, which can be disabled and added some other policies.
For example, When we want the Glimpse to run remotely, wechange the following configuration
|
1 2 3 4 5 6 7 |
<glimpse defaultruntimepolicy="On" endpointbaseuri="~/Glimpse.axd"> <runtimepolicies> <ignoredtypes> <add type="Glimpse.AspNet.Policy.LocalPolicy, Glimpse.AspNet"> </add></ignoredtypes> </runtimepolicies> </glimpse> |
Start your Glimpse
Now we have discussed uptill now how to and from where to add Glimpse to your application and the changes in the Web.config the installation does. As well as the configuration changes we can do. To start the Glimpse we need to run the application and browse through the same host adding: “host/glimpse.axd” First lets see a diagram that shows the latest Glimpse UI overay. After getting into the browsed link the page shown is as below, that is a part of the page:
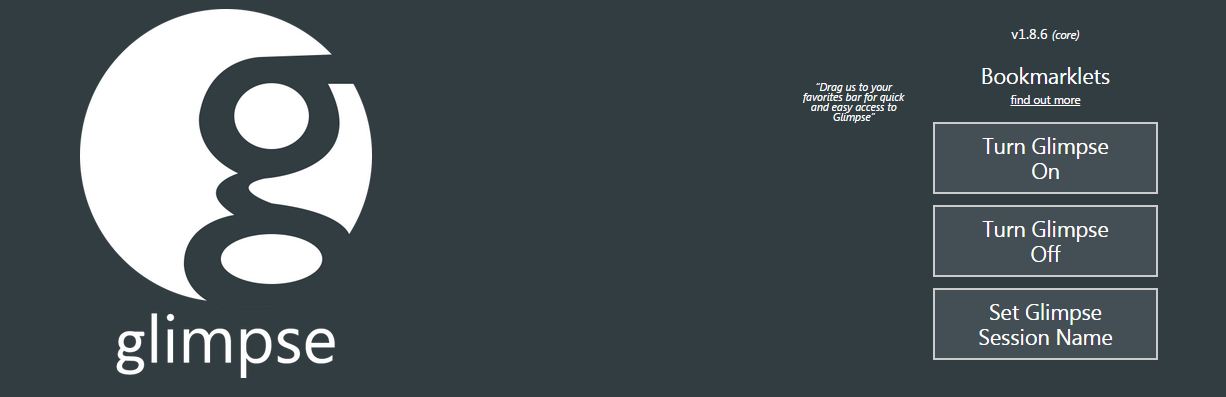
After this, we need to click on the Turn Glimpse On. This turns on the Glimpse, then in the application or “/Home/Index” shows a small glimpse “g” icon towards the right bottom. Click on that to see the Glimpse overlay Magic..

The above figure shows the jist or a brief view of the request made & time taken, or the Magic Glimpse has. The below figure shows the detailed window for the Glimpse, this has a part of the window but all the default and MVC tabs are enabled and shown to the end user.

A brief on some important Tabs
Lets discuss briefly on the tabs used by Glimpse or that is displayed to the end user. The tabs let the users know in details about their application and even the machine the application is running on…Strange!! Lets have a look:
Configuration Tab
This tab gives very useful information about the Machine configurations & Web configurations. It gives the details about the application settings, the connection strings used, Web Authentication modes, the custom errors mode and Defaut redirect page, the Http handlers and Http Modules. To literally say, this gives the overview of theconfiguration settings used in Web.config. Have a look at the below image:
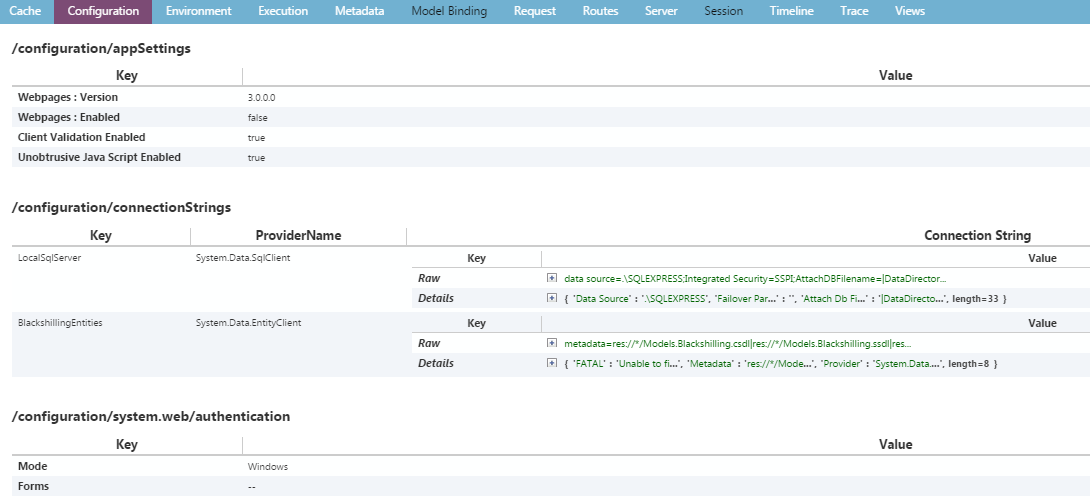
One can mark in the Image or when used in the configuration tab there is Connenction strings, that shows both the default connection present in the Web.config as well as the default connection strings present in the Machine.config. The XML format that is,/configuration/appSettings, makes easier to find it in the Web.config.
Environment Tab
This tab gives information about the Server that handles the request. Shows information like name of theMachine, which dotnet framework application is running. Even the assemblies that are loaded. Lets have a look at the image below showing the Environment tab:
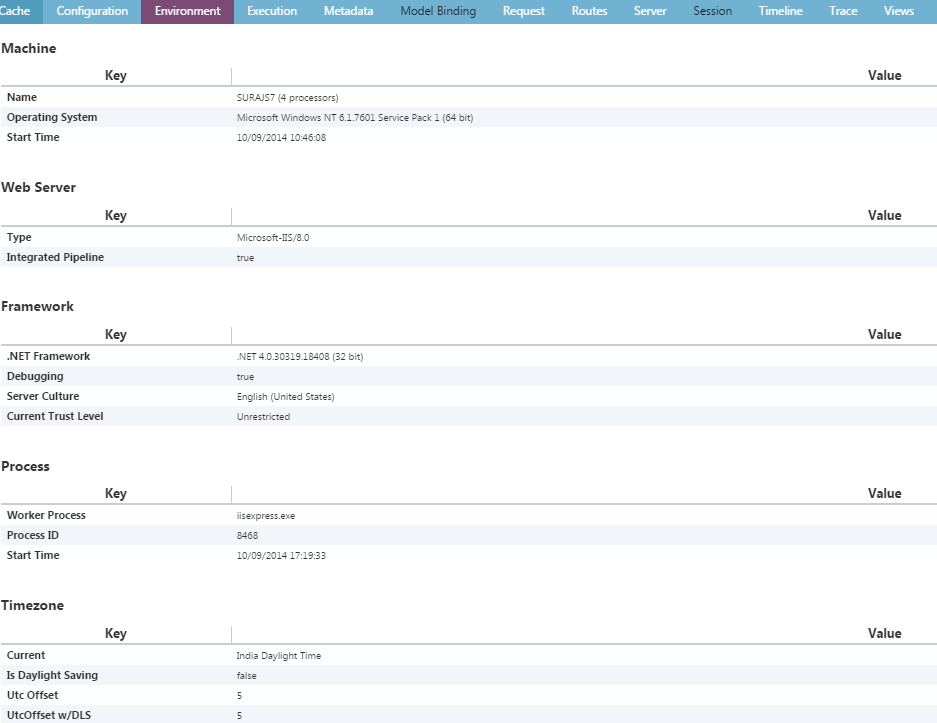
The above image shows the Environment tab and the data it gives. It gives information regarding the Processes running like iisexpress along with its ProcessID, gives information regarding the TimeZone, that would anyhow help developers with the timezone related issues at some point of time. This shows the information about theweb Server also like Microsoft-IIS/8.0 running on my machine. Also the Application assemblies and the system assemblies are produced in this tab.
Request Tab
This tab would seem to have reduntant data that is also present on the developer tools, but that is not the case. It has the exact data that the server received. This tab solves the problem of the developers trying to troubleshoot a tricky issue where the request is being modified or intercepted using fiddler or some other tools before reaching the server or Asp.Net can handle that. Lets have a quick look at the tab image:

As you can see I have highlighted the Query string parameters to show as it is displayed in key value pairs and also in the actual Url. This gives information about the User Host address and User Agent. The Host address is “::1” as i was running the application on my local system.
Routes Tab
This gives the information about all the routes that are registered and which routes are called for a specific page. This also gives information about the Areas if any used, also the Api controllers used & the normal controllers registered in the route.config. Lets have a quick look at the Route tab:
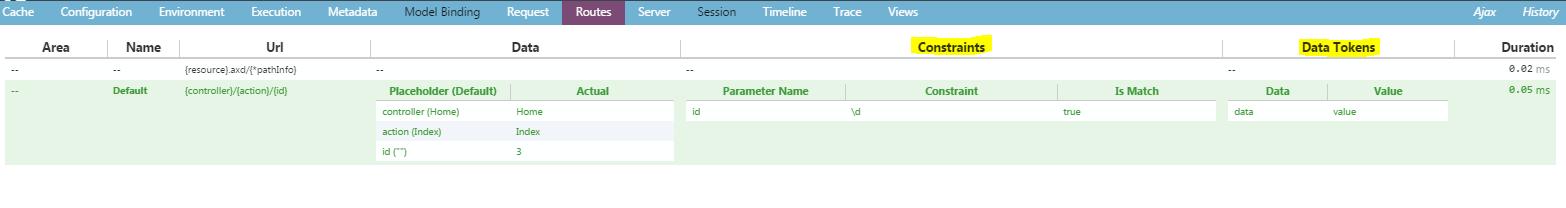
Here, in the Image we see the Constraints & Data tokens highlighted. The greyish background shows the actual route being used for this page. We rarely have constraints and Data tokens defined in our routes,but this information also proves useful. Lets go ahead and look into the code for adding the Constraints and Data token:
|
1 2 3 4 5 6 7 8 9 10 11 12 13 14 15 16 17 18 19 20 |
using System.Web; using System.Web.Mvc; using System.Web.Routing; namespace KendoMvcDemo { public class RouteConfig { public static void RegisterRoutes(RouteCollection routes) { routes.IgnoreRoute("{resource}.axd/{*pathInfo}"); routes.MapRoute( name: "Default", url: "{controller}/{action}/{id}", defaults: new { controller = "Home", action = "Index", id = UrlParameter.Optional }, constraints: new RouteValueDictionary { { "id", @"\d" } } ).DataTokens = new RouteValueDictionary { { "data", "value" } }; } } } |
This is the Code for adding the constraints, here in the constraints we have added a regular expression to mandate the field id (parameter) to be a single digit value only. We have given some random values to the data tokens.
We can see these data in the Route tab image provided. Now, when we run the application after adding these constraints, we would get IIS forbidden error as the default route now expects an id that to be a single digit.
Session Tab
You might observe in the above images everywhere, the Session is disabled/blackened. This is because we donot have any session defined for this page. Once we define the session for a specific page, then we can view the session to be active with the key value pairs. See the image below that shows the Session defined and the value.

Here, I have defined a session like
|
1 2 3 4 5 6 7 8 9 |
public ActionResult Index() { Session["Test"] = 1; var blackshilling = new BlackshillingEntities(); ViewBag.Properties = blackshilling.Properties; ViewBag.Message = "Welcome to ASP.NET MVC!"; return View(); } |
You can see the value of Session Test as 1 in the image.
Points of Interest
We have discussed much on the Glimpse use and the Important Tabs. Hope this package comes handy for the developers in enhancing and knowing their application better. This would help out during the optimization phase, where it would be required to judge the Sql operations their execution time and many. I will be writing a tip/article on this in upcoming days.